Drug Overdose and Related Comorbidity County Profiles Dashboard Updated
The Kentucky Injury Prevention and Research Center (KIPRC) has released the latest update to the Drug Overdose and Related Comorbidity County Profiles Dashboard, expanding the tool’s functionality and accessibility for communities across the state. The update adds new data, regional views, and features long requested by dashboard users.
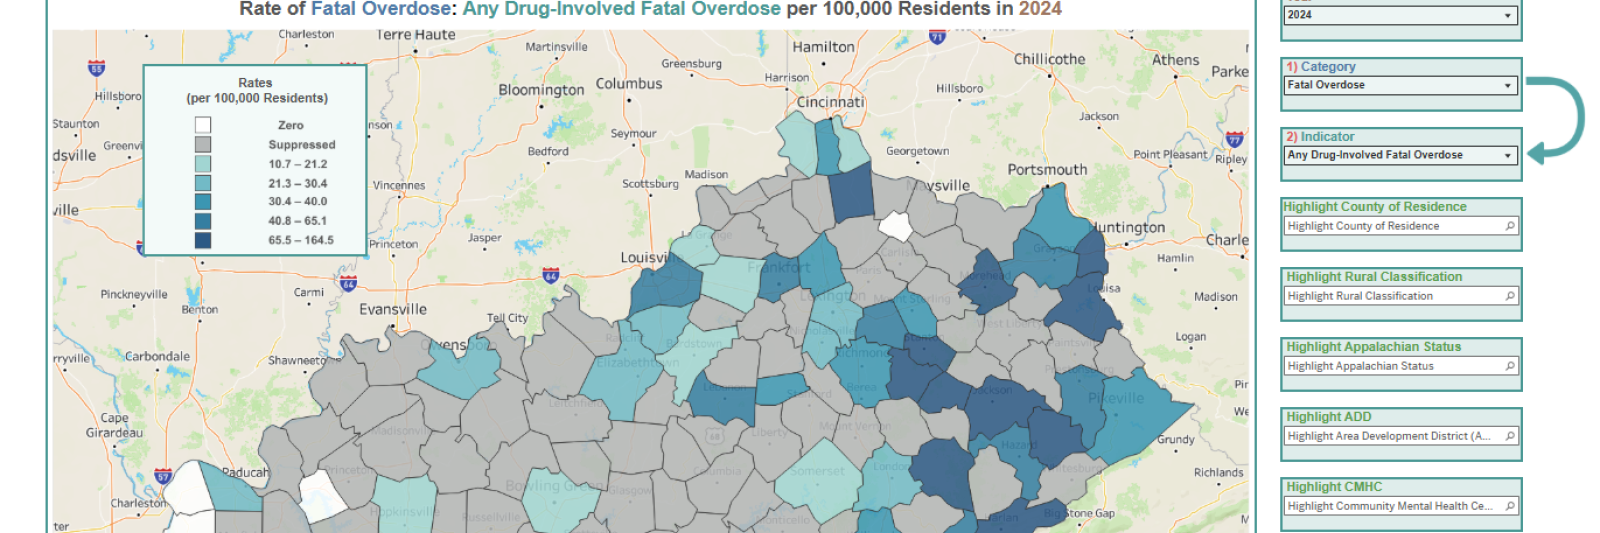
This iteration includes 2024 annual data and updates the rolling four‑quarter view through Q1 2025, giving policymakers, local and health departments and community partners one of the most current and comprehensive drug overdose surveillance tools available in Kentucky.
“We made a lot of overarching edits this round based on what users told us they needed,” said Mira Mirzaian, epidemiologist at KIPRC. “Our goal is to make sure people can get to the information they need quickly, in a format that’s useful to them.”
New regional views for more meaningful comparisons
One of the most significant enhancements is the addition of multiple regional classification filters, reflecting the types of geographic breakdowns most frequently requested by dashboard users. The dashboard now allows users to filter the table and highlight the map by:
- Area Development Districts (ADDs)
- Community Mental Health Centers (CMHCs)
- Local Health Departments (LHDs)
- Department for Community Based Services (DCBS) regions
- Appalachian status
- Rural classification
With these additions, Mirzaian said users can now access nine years of data across 31 drug‑related indicators with individual measures grouped into broader categories on the dashboard and organized in ways that better align with how Kentucky’s public health and community systems operate.
New Download Data feature
For the first time, the dashboard includes a Download Data button. When selected, it opens an Export Dashboard window where users can download datasets specific to their needs. The downloaded files are fully suppressed, meaning any small or potentially identifiable counts are masked to ensure confidentiality.
“We continually heard that people wanted a way to take the data with them,” Mirzaian said. “This update finally gives them that flexibility.”
Refined visualizations and improved accessibility
Several visual and structural improvements were introduced to make the dashboard easier to interpret:
- A refined bump chart now shows rankings of drug type involvement by year, with views for the overall population, age groups and race. The visualization mirrors the style used in Kentucky’s Annual Overdose Mortality Report but adds interactive hover‑over tooltips for deeper exploration.
- To improve readability, the map now uses a five‑group color system (known as quintiles) that evenly distributes counties into color categories. This change creates clearer distinctions between counties and makes it easier to interpret zero, suppressed, and populated data at a glance.
- Directional arrows were added to guide users through the filter order, supporting a more intuitive navigation experience.
These updates reflect KIPRC’s ongoing effort to make complex data easier to understand and use.
The dashboard continues to be a widely accessed resource. The previous iteration received 3,942 unique views between Aug 20, 2024 - Jan 29, 2026, underscoring the demand for timely, county‑level drug overdose data and the importance of continued investment in user‑centered improvements.
KIPRC is a unique partnership between the Kentucky Department for Public Health (DPH) and the University of Kentucky’s College of Public Health. KIPRC serves both as an academic injury prevention research center and as the DPH’s designee or “bona fide agent” for statewide injury prevention and control.